
Choose the right workflow for the question you need to answer
TL;DR: Choose an analytics tool based on the question, the data and who needs to check the result. Excel suits workbook calculations; SQL helps inspect database records; Python with pandas supports repeatable data preparation; Power BI and Tableau support shared reporting and visual analysis; and QuaerisAI supports questions across governed business data. These tools can work together. Test one real business question, then compare correctness, permissions, source traceability and repeatability before choosing a workflow.
Your dashboard shows more leads. Sales says the leads are weaker. Finance wants to know whether the extra spend paid off.
At that point, the question is not just which analytics tool to open. The better starting point is understanding the question, the available data, and who needs to check the result.
Excel, Power BI, Tableau, SQL, Python, and QuaerisAI can all support analytics work, but they serve different purposes.
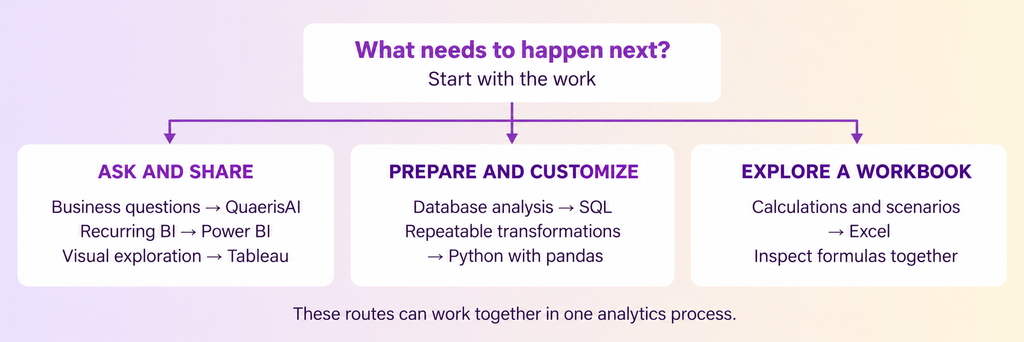
Excel is useful for workbook-based investigations. Power BI and Tableau support shared reporting and visual analysis. SQL and Python help analysts prepare, test, and transform data. QuaerisAI supports questions across governed business data.
These workflows can complement one another in the same analytics process.
This guide is an editorial shortlist, not a performance benchmark. QuaerisAI is included because it is our offering, but the numbering does not indicate rank.
Compare the job before comparing the product
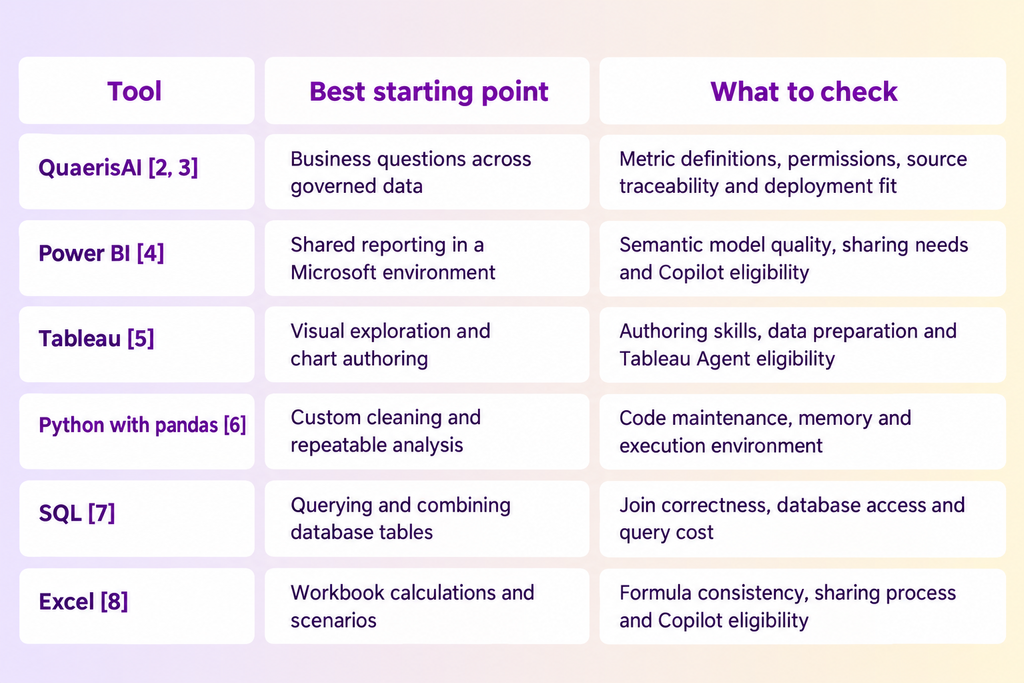
Analytics work usually moves through preparation, calculation, reporting, and investigation.
Different tools are stronger at different stages. Before comparing products, compare the job the team needs to do.
The point is simple: start with the work, then choose the tool.
A team inspecting workbook formulas has a different need from a team governing metric definitions across departments. A data analyst checking joins has a different job from a business user asking why a campaign changed.
The wrong tool may still produce an output. The better tool gives the team a result they can understand, check, and repeat.
A language and a platform are different decisions
Python and SQL should not be evaluated in the same way as BI platforms.
Python is a programming language. pandas is an open-source Python library for working with data. SQL is a language used to query databases. They are powerful, but they still require an execution environment, maintenance, access controls, and people who can review the work.
AI assistance can make coding and querying faster, but it does not automatically turn Python or SQL into governed analytics products.
For buyers, the practical question is whether the team can maintain the workflow, control access, check the logic, and repeat the result later.
Start with the question your current setup cannot answer
Most organizations already have analytics tools. The real buying question is usually about the gap.
What question is your current setup struggling to answer?
For some teams, the issue is exploration. Users can see a dashboard, then struggle to ask the next question.
For others, the issue is repeatability. A useful analysis exists, but it depends on one analyst, one script, or one workbook.
For regulated or enterprise teams, the issue may be traceability. The result exists, but the team cannot clearly show which definition, source, permission, or calculation produced it.
A good evaluation should start with a specific workflow, not a generic feature checklist.
Ask:
Who asks the question?
Who owns the metric?
Who fixes the data?
Who checks the result?
Can the workflow be repeated?
The answers will show where the bottleneck sits.
Where each tool earns its place
1. QuaerisAI for governed business questions
Evaluate QuaerisAI when business users need to ask questions across governed enterprise data.
A useful test is to start with an ambiguous term such as active customer. Ask the system to define the metric, show the source, and repeat the question with a restricted user.
The goal is to see whether the workflow respects definitions, permissions, and traceability.
This is especially relevant when teams need results that can be checked later, rather than one-off outputs that are difficult to reconstruct. [2, 3]
2. Power BI for shared reporting and follow-up analysis
Consider Power BI when reports and semantic models already support your Microsoft workflow.
Power BI is useful for shared dashboards, recurring reporting, and business reviews where the organization has already invested in semantic models and permissions.
Copilot can assist with reporting, summaries, and data questions, but the experience still depends on the underlying model, capacity eligibility, and enablement.
A practical test is to use a trusted measure and check whether users can understand the result, share it appropriately, and continue the analysis without creating confusion. [4]
3. Tableau for visual investigation
Tableau supports visual investigation and chart authoring.
It is useful when users need to compare regions, change measures, and inspect how a visual changes when the view changes.
Tableau Agent can assist with charts, calculations, and filters, but teams should confirm supported operations, deployment eligibility, and access in their own environment.
A useful test is to request a regional comparison, change the measure, and inspect what stayed constant. [5]
4. Python with pandas for repeatable data preparation
Use Python with pandas for recurring cleaning, joins, grouping, reshaping, and tabular analysis.
It is flexible, but it still needs maintenance. Someone must review the code, manage changes, check AI-generated edits, and test edge cases such as missing values or duplicates.
The main risk is treating a script as reliable just because it runs.
A good workflow checks the data before trusting the totals. [6]
5. SQL for examining the data behind the result
SQL helps analysts filter, join, and aggregate structured database tables.
It is useful for checking the data behind reports, dashboards, and AI-generated outputs. It can also help confirm whether the right records are included in a result.
The common risk is join logic. A query can multiply transactions, exclude records, or produce a misleading total if the relationships are wrong.
SQL gives control, but it does not guarantee correct analysis by itself. [7]
6. Excel for collaborative workbook analysis
Excel supports formula inspection, scenario analysis, and workbook-based collaboration.
It is familiar and flexible, especially for finance and planning workflows where teams need to see the calculation directly.
Copilot can assist in Excel depending on license, app, and configuration. Teams should still keep a known reference calculation and review changes before sharing.
Recurring workbooks need ownership, version control, and review discipline. [8]
What 2026 research changes about the buying decision
Enterprise AI adoption is moving from isolated experiments toward broader deployment.
McKinsey’s August 2026 survey reported enterprise AI scaling rising from 38 percent to 44 percent of respondents. This describes broader adoption, not any analytics product’s market share or effectiveness. [10]
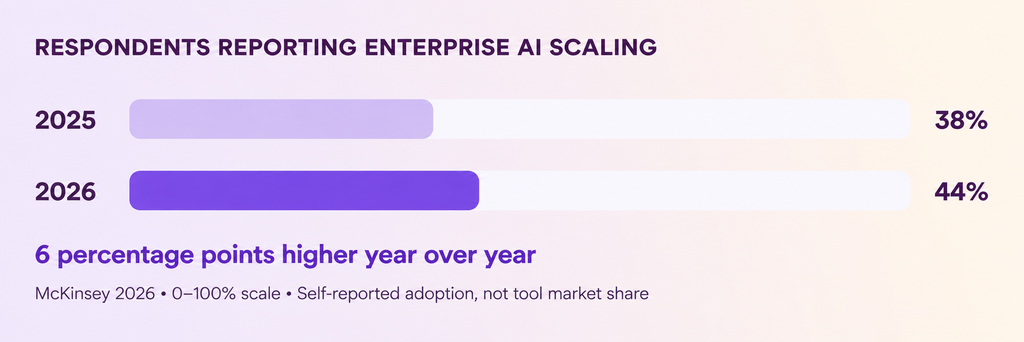
Figure 2. Respondents reporting AI scaling across their enterprise. Survey findings do not establish product effectiveness. [10]
The practical takeaway for buyers is that AI capability alone is not enough. Teams need to understand whether AI can work inside their definitions, permissions, workflows, and review standards.
Context is becoming a buying criterion
A major analytics challenge is getting AI systems to understand business context.
Alteryx’s August 2026 study reports that 53 percent of surveyed organizations struggle to translate business context into AI workflows. The vendor-sponsored research was based on a Coleman Parkes survey of 1,400 technology leaders. [11]
For analytics buyers, the practical implication is clear: demos should test more than the interface.
They should test:
metric definitions
exceptions
access rules
source visibility
permission handling
what happens when the system does not have enough information
A clean demo is useful. A workflow test is better.
Research is moving beyond isolated queries
Analytics evaluation is also moving beyond simple question-and-answer tests.
The September 2026 BI-Agent and BI-Bench preprint evaluates tasks such as finding tables, transformations, and joins. The authors report below-50 percent accuracy for the frontier LLMs tested, improving with their specialized approach. The benchmark does not compare the six tools in this guide; it supports testing complete workflows. [12]
That matters because a tool may answer a clean prompt in a demo.
The real test is whether it can handle the path from question to source, transformation, calculation, validation, and review.
Product changes can make tutorials outdated
Analytics products are changing quickly.
Microsoft retired Excel’s preview COPILOT function on September 14, 2026, while the Copilot pane remains. Power BI and Tableau also offer conversational assistance within established BI environments. [4, 5, 13]
The lesson is simple: check current product availability before relying on a tutorial, demo, or old implementation note.
Product packaging, eligibility, licensing, and supported features can change. The evaluation should be based on the current environment your team will actually use.
Compare workflows with one real business question
The best way to evaluate analytics tools is to test one real business question across workflows.
Some follow-up questions need new modeling or specialist work. Others can be answered with already-approved data and definitions. Both paths are valid, but they should be measured against the same standards.
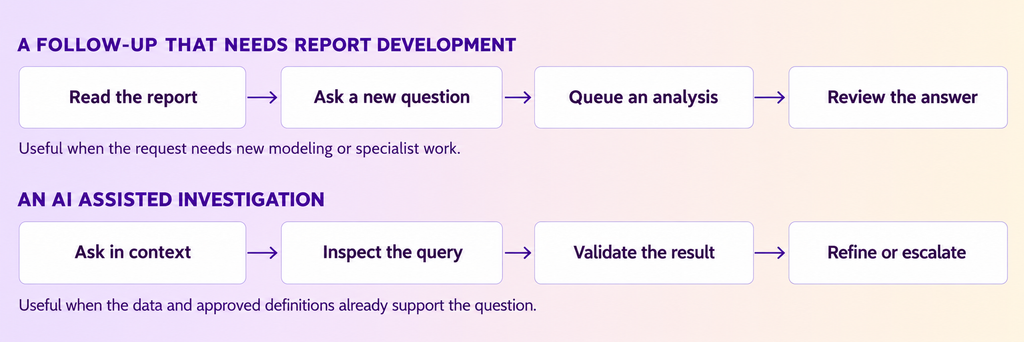
Figure 3. Two illustrative follow-up paths. Both can exist in the same platform; this is not a timing benchmark.
Now try a simple test.
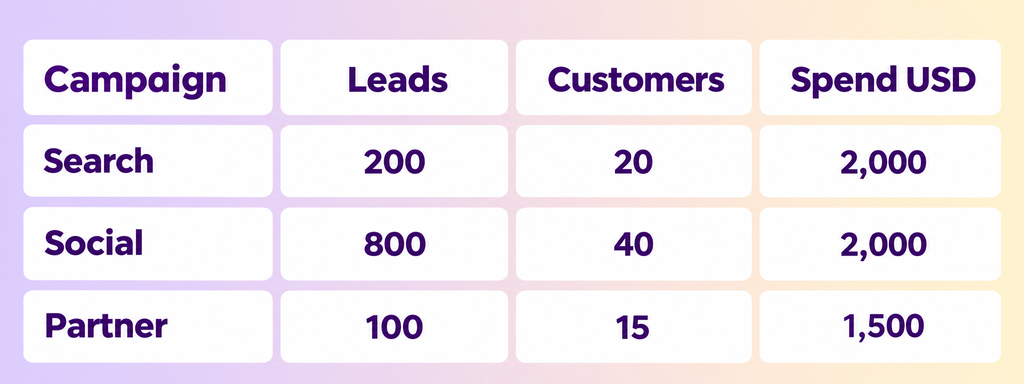
These fictional campaigns use the same period:
Ask your chosen tool:
“Calculate customer conversion rate and cost per customer by campaign. Show the formulas. Then calculate the combined conversion rate. Explain whether these numbers alone justify a budget change.”
Before calculating, predict which campaign has the highest lead-to-customer conversion rate.
Then test the follow-up:
“What if customer counts include duplicates across campaigns?”
A useful response should request the relevant identifiers or explain the limitation. It should not silently treat those customer counts as unique people if that has not been established.
Record:
correctness
time to a checked result
analyst help required
repeatability
whether the tool explains limitations
whether it can be tested with fresh data
whether it respects a restricted user’s permissions
Check the result, then check the workflow
The combined conversion rate is 75 customers divided by 1,100 leads, or 6.82 percent, assuming consistent counting rules. Averaging the three campaign percentages gives the wrong combined rate.
This small example shows why analytics evaluation should go beyond whether the tool returns a number.
Partner has the highest conversion rate. Social has the lowest cost per customer. Neither finding establishes profitability or proves that the budget should change. A real decision would need more evidence, including customer value, attribution, and duplicate handling.
What to measure in the evaluation
When testing any analytics workflow, separate the measures.
Look at:
whether the result was correct
how long it took to reach a checked result
how much analyst help was needed
whether the result could be repeated
whether definitions were clear
whether permissions were respected
whether the source could be inspected
whether the tool explained limitations instead of guessing
Then repeat the test with fresh data and a restricted user.
That final step matters. A workflow that works for an admin user may fail when access rules, incomplete data, or ambiguous terms are introduced.
Choose the workflow your team can trust and repeat
The best analytics tool is not always the most advanced one.
It is the one that fits the question, the user, the data, and the review standard.
Use Excel when the work belongs in a workbook and the logic needs to be inspected. Use SQL when you need to examine structured data behind the result. Use Python with pandas when the work requires repeatable preparation and custom analysis. Use Power BI or Tableau when the team needs shared reporting and visual analysis.
Evaluate QuaerisAI when business users need governed questions across enterprise data with definitions, permissions, and source traceability in the workflow.
To evaluate QuaerisAI, bring a real question, the definition behind it, and a reference result. Ask for a checked result, then change the question and permissions. Judge the workflow by what it improves. [2]
That is the clearest way to compare analytics tools in 2026: start with the work, test the workflow, and choose the tool your team can trust enough to repeat.